-
Learning by doing
-
Trainers with practical experience
-
Classroom training
-
Detailed course material
-
Clear content description
-
Tailormade content possible
-
Training that proceeds
-
Small groups
In the course Data Analysis with Python you will learn how to use the Python language and Python libraries in Data Analysis projects.
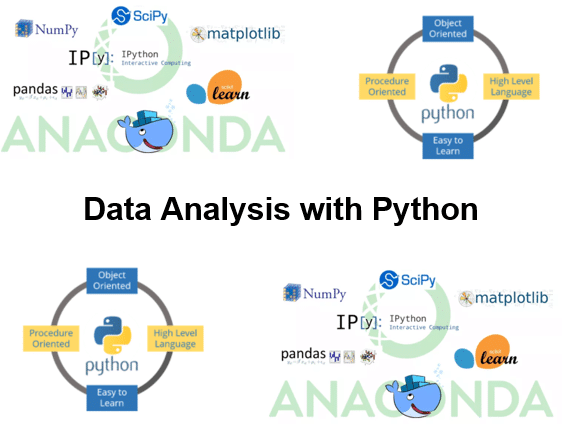
The course Data Analysis with Python starts with a bird's eye view of the Python syntax aspects that are important in Data Analysis projects. Variables, data types, functions, flow control, comprehensions, classes, modules and packages are discussed. The operation of the Jupyter notebooks, the IPython shell and installing Python packages in Anaconda are also treated.
Next the course Data Analysis with Python pays attention to the NumPy package with which large data sets can be processed very efficiently. NumPy's ndarray object and its methods are treated and attention is paid to the different array manipulation techniques with broadcasting and vectorized operations.
Then use of the Pandas library for data analysis is on the schedule of the course Data Analysis with Python. The pandas library introduces two new data structures in Python that use Numpy and are therefore fast. The data structures are DataFrame and Series and extensive details are given on how to use them for data analysis when inspecting, selecting, filtering, combining and grouping data.
Also discussed in the course Data Analysis with Python is the MatPlotlib library, which is closely integrated with NumPy and is a very powerful tool for creating and plotting complex data relationships.
Finally attention is paid to the essentials of the Scikit-Learn library for modeling. The course Data Analysis with Python uses many practical examples and shows how one- and two- and three-dimensional data sets can be visualized.
The course Data Analysis with Python is intended for data analysts who want to use Python and the Python libraries in Data Analysis projects.
To participate in this course knowledge of and experience with any programming language or package such as SPSS, Matlab or VBA is desirable. The course starts with a discussion of the principles of the Python programming language.
The theory is discussed on the basis of presentation slides. Illustrative demos clarify the concepts. The theory is interchanged with exercises. The Anaconda distribution with Jupyter notebooks is used as a development environment. Course times are from 9:30 to 16:30.
After successful completion of the course participants receive an official certificate Data Analysis with Python.

Module 1 : Python Language Syntax |
Module 2 : Functions and Modules |
Module 3 : Classes and Objects |
|
Python Features Running Python Anaconda Distribution IPython Shell Interactive and Script Mode Python Data Types Numbers and Strings Sequences and Lists Sets and Dictionaries Python Flow Control Exception Handling |
Pass by Value and Reference Scope of Variables EFAP principle What are comprehensions? Lambda Operator Filter, Reduce and Map List comprehensions Set and Dictionary comprehensions Creating and Using Modules import Statement from…import Statement |
Creating Classes Creating and Using Objects Accessing Attributes Property Syntax Constructors and Destructors Encapsulation Inheritance super Keyword Checking Relationships issubclass and isinstance Overriding Methods |
Module 4 : Numpy |
Module 5 : Pandas |
Module 6 : Data Manipulation |
|
NumPy Numerical Types Data Type objects dtype attributes Slicing and Indexing Array comparisons Manipulating array shapes Stacking and Splitting arrays any(),all(), slicing, reshape() Manipulating array shapes Methods of ndarray Views versus copies ravel(),flatten(),transpose() |
Pandas DataFrame Import Data Inspect Data Data Visualization DataFrame Data Types Indexing and selection Data operations in pandas Missing Data Hierarchical Indexing Plotting with Pandas Combining Datasets Exploratory Data Analysis |
Indexing Data Frames .loc and .iloc Accessor Slicing and Indexing a Series Filtering with Boolean Series Zeros and NaNs all and any Nonzeros Using map Function Hierarchical Indexing Rearranging Data Reshaping by Pivoting Transformation and Aggregation Grouping Data |
Module 7 : MatplotLib |
Module 8 : Time Series |
Module 9 : SciKitLearn Essentials |
|
Simple Plots Plot format String Subplots Histograms Logarithmic Plots Scatter plots Fill between Legend and Annotations Three Dimensional Plots Contour Plots Transformations Projections |
Indexing Pandas Time Series Reading and Slicing Times Using a DatetimeIndex Reindexing the Index Separating and Resampling Rolling mean and Frequency Resample and Roll with it Manipulating Time Series Method chaining and Filtering Missing values and Interpolation Time Zones and Conversion Plotting Time Series |
SkiKit Learn library Machine learning essentials Supervised and Unsupervised Feature matrix Target array Estimator API Hyperparameters Fit method Predict method Model Selection Linear Regression Logistic Regression |
